"We've never had a decline in house prices on a nationwide basis. So, what I think what is more likely is that house prices will slow, maybe stabilize, might slow consumption spending a bit. I don't think it's gonna drive the economy too far from its full employment path, though." 7/1/2005
"Housing markets are cooling a bit. Our expectation is that the decline in activity or the slowing in activity will be moderate, that house prices will probably continue to rise." 2/15/2006
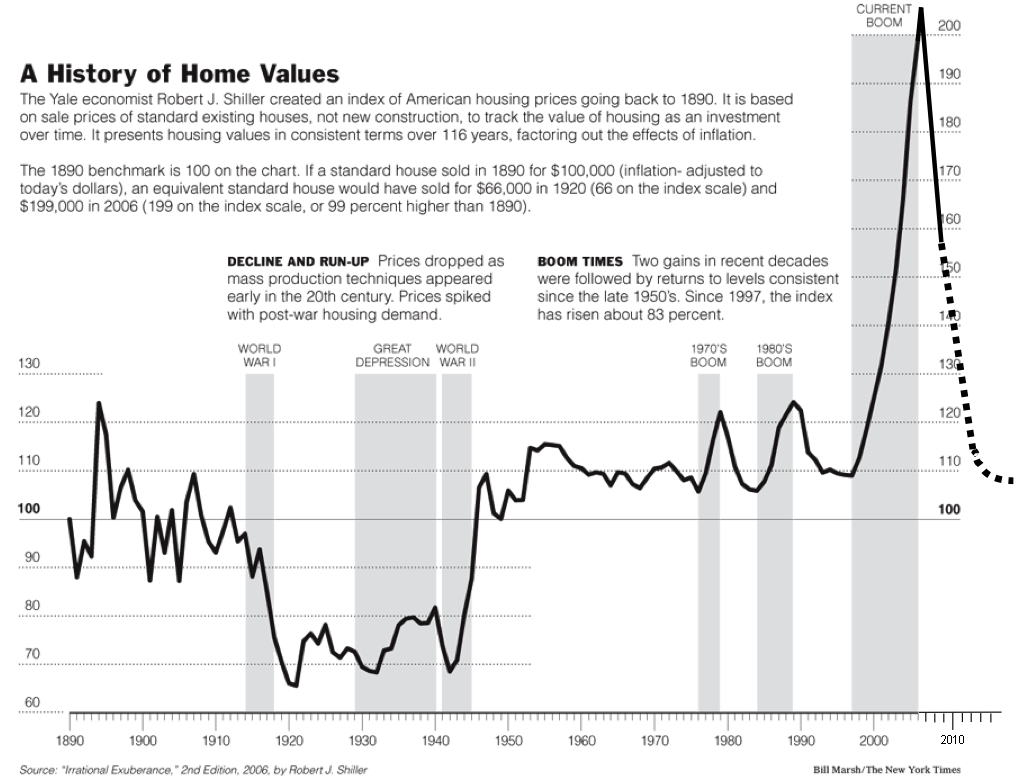
Bennie actually made these statements when the chart below showed home prices at their absolute peak. You should keep this in mind whenever this rocket scientist opens his mouth about anything. And always remember that he is a self proclaimed "expert" on the Great Depression. That should come in handy in the next few years, just like his brilliant analysis of the strong housing market.
Source: Barry Ritholtz
Easy Al Greenspan created the Mother of All Bubbles by keeping interest rates at 1% for a prolonged period of time while encouraging everyone to take out adjustable rate mortgages. His unshakeable faith in the free market policing itself allowed Wall Street criminals, knaves and dirtbags to create fraudulent mortgage products which were then marketed to willing dupes and "retired" internet day traders. Al's easy money policies and disinterest in enforcing existing banking regulations also birthed the ugly stepsister of the Mother of All Bubbles. Her name is the Consumer Debt Bubble. The chart below is hauntingly similar to the home price chart above. The consumer will be deleveraging for the next ten years. The numbskulls on CNBC and the other mainstream media have been falsely reporting for months that consumers were deleveraging when it was really just debt being written off by banks. Baby Boomers are not prepared for retirement and will be shifting dramatically from consuming to saving. As consumer expenditures decline from 70% of GDP back to 65% of GDP, consumer debt will resemble the home price chart to the downside.
The savings rate has soared all the way to 6% of personal income. This is up dramatically from the delusional boom years of 2004 and 2005 when it bottomed out at 1%. It ain't even close to being enough to fund the looming retirements of the Baby Boomers. The savings rate averaged 10% from 1959 through 1989. In order for the American economy to revert to a balanced state where savings leads to investment which leads to wage increases, the savings rate will need to be 10% again. With annual personal income of $12.5 trillion, Americans will need to save an additional $500 billion per year. This means $500 billion less spending at the Mall, car dealerships, Home Depot, tanning salons, and strip joints. Don't count on a consumer led recovery for a long long time.
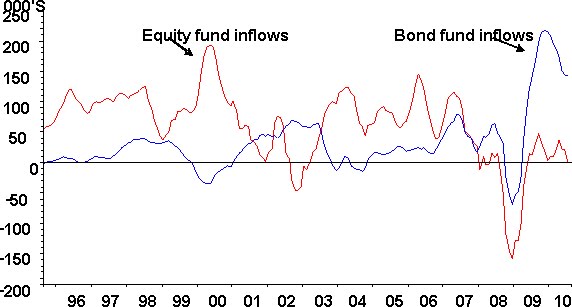
So here we stand, two years after the worldwide financial system came within a few hours of imploding, and nothing has changed. Wall Street is still calling the shots. The political hacks that supposedly run this country have kneeled down before their insolvent Masters of the Universe. Bennie Bernanke has chosen to save his Wall Street masters and throw grandma under the bus. By keeping interest rates at zero, buying up trillions in toxic mortgages, and printing money as fast as his printing presses can operate, Bennie has birthed the bastard child of the mother of all bubbles. The chart below clearly shows the birth of this bastard. It is a distant cousin of the internet bubble bastard. Despite interest rates at or near all-time lows across the yield curve, money has poured into Treasury bonds. This makes no sense, as interest rates can't go much lower. A small increase in rates will produce large losses for investors at these rates.

Source: Barry Ritholtz
Only a fool would buy a US Ten Year Treasury bond today yielding 2.55%. Of course, only a fool would buy a 1,300 square foot rancher in Riverside, California for $800,000 with 0% down using an Option ARM in 2005 too. But that doesn't mean there aren't millions of fools willing to do so. Each "investment" will have the same result huge losses. As anyone can see from the chart below, the 10 year Treasury has been in a 30 year bull market. At this point you have to ask yourself one question. Do you feel lucky? Well do you, punk? There are a number of analysts who see rates falling further as the economy sinks into Depression part 2. That may happen, but we all know that Bennie and those in power will do anything to avoid a deflationary spiral. That means looser money and more printing.
The Federal Reserve does not want a 20 year recession like Japan. They will not get it. They'll get a hyperinflationary collapse instead. Japan entered their 20 years of stagnation with a population that saved 18% of their income and huge trade surpluses. The Japanese government could count on the Japanese population to buy every bond they issued to pay for worthless stimulus projects. The US has entered this Depression with a population that saved 2% of their income and a trade deficit of $500 billion. John Hussman describes the differences between the US and Japan in his recent newsletter:
(Note: You can view every article as one long page if you sign up as an Advocate Member, or higher).


