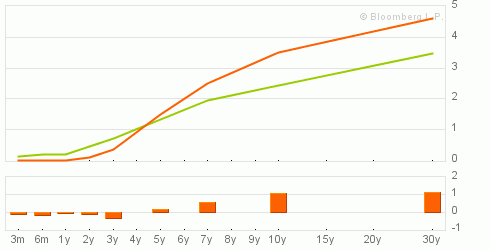
I explained in these articles that a twist of the yield curve from a grossly undervalued configuration to a fair valuation was in the way:
The orange yield curve is the recent lowest yield curve (on August, 25th).The green yield curve is the expected, almost normal, yield curve (on Sept 17th).
Hammer:
We had a splendid Hammer on August 25th on 10 Years US Treasury Notes:
Runaway Gaps:
Other Supporting Evidences:
I remind you that this Twist of the yield curve does not come from any macro economic reason but only as a dynamic return of the yield curve from a formidably undervalued configuration to its fairly valued configuration.
Prove is that in getting that reversal we didn't get extraordinarily good macro economic figures: they were just as bad as usual. The reaction to Jackson Hole meeting which in other times would have crushed down long-term yields had just the opposite effect.
Economic Expectations:
The Federal Reserve System will necessarily misinterpret that steepening of the yield curve:
The Yield Curve as a Leading Indicator
Forecasting Recessions: the Puzzle of the Enduring Power of the Yield Curve
Market Movements:
Fixed Rates:
Expect the upward trend of the yields long-term treasuries to continue and accelerate. For the Yields on 10 Years US Treasury Notes the objective is 3.500% [ 121 on December Futures on 10 Years US treasury Notes] on September 17th which means that we have already made 30 BIPs and we have still 75 to make in 8-9 days that makes an average increase of 9 BIPs.
As chasing rates will be less a necessity the spreads between corporate and government bonds (in perticular junk) will widen. Junk bonds, of course, will collapse with the crash.
TED Spread:
(Note: You can view every article as one long page if you sign up as an Advocate Member, or higher).


