The Alaskan Senate race between convicted felon Republican Ted Stevens and Democrat Mark Begich continues to take a number of twists and turns and is far from over. At the end of November 5th Ted Stevens had a 3257-vote lead over Mark Begich and political pundits were declaring the race essentially won by Ted Stevens. The subsequent speculation then turned to what would happen when the convicted Senator would rejoin his colleagues in the Senate. That was until it was revealed that over 90,000 absentee and provisional ballots remained to be counted in Alaska, almost 1/3 of all the total ballots that would be cast in this race. Over the past few days about 75,000 of these remaining 90,000 ballots have been painstakingly analyzed and counted by hand and Democrat Mark Begich is now leading by just over 1,000 votes. The remaining 15,000 ballots are expected to be counted by Tuesday of next week.
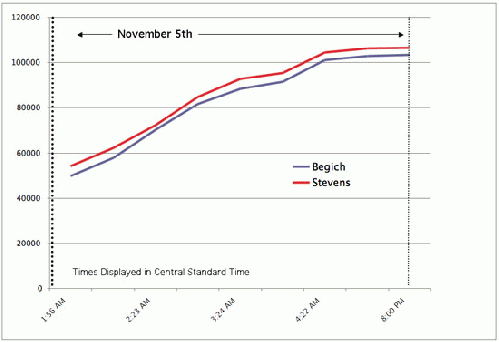
Because of the interest and closeness of this race, we collected time-stamped snap-tallies from the wee morning hours of November 5th and analyzed the patterns and vote spreads between the two candidates, Ted Stevens and Mark Begich. These snap-tallies were transcribed from various media outlets, blogging sites, and from the Alaskan Secretary of State Election website throughout the night. Dozens of internet sources were cross-checked and the timepoints of the results were compiled and graphed over the course of the evening as shown below in figure 1.
The vote spreads for the first 10 snap-tallies collected (all favoring Ted Stevens) were 4360, 4443, 2077, 3113, 4526, 3984, 3596, 3353, and 3257 respectively and represented the period between 37% reporting to 99% reporting. Even on first analysis the spreads seemed to show a remarkable consistency.
Where the votes were coming from within Alaska between the 37% reporting to 99% reporting periods would of course dictate these results. Unless all reporting from urban areas were done and included by the 37% reporting result, one would expect to see mixtures of results coming in from both rural and urban areas like that seen in all the other state-wide Senate races. It is clear from pre-election polling data and even exit polling data that the urban areas such as Anchorage were significantly favoring Begich. Because Mark Begich was the mayor of Anchorage and was quite popular it would not be surprising to see him do well among voters in the urban areas.
However, the stability and consistency of the spread between Stevens and Begich for the votes that came in during the 37% - 99% reporting period - where Stevens showed a consistent 2000 – 4000 vote lead over Begich - suggested that the majority of these 106,089 ballots cast were from rural areas. If that were so, then the very initial results should have been almost entirely urban and would have been expected to show a significant lead for Mark Begich. That was not the case as the first snap-tally we were able to collect was the following:
R-Stevens, 54,101 (49%)
D-Begich, 49,741 (46%)
37% reporting (160 precincts out of 438)
Another explanation for this surprisingly consistent vote spread would be that there was a consistent ratio of urban to rural reporting over these 10 reporting periods that stretched over a period of about 4-5 hours in the wee morning hours of November 5th.
The patterns of electronic voting machine usage and patterns of electronic vote tallying throughout the state of Alaska was not know at the time of this analysis. However, we did compare the randomness of the voting spread for the tallies collected through November 5th to the more recent tallies that have been reported during the hand-counting of the 90,000 or so absentee and provisional ballots.
In a multivariate process like counting election ballots from hundreds of different precincts all with differing demographics and rural and urban makeups it is hard to believe that a vote spread could be so seemingly non-random during the electronic counting of the ballots and then become significantly more random during the hand-counting of the absentee and provisional ballots. But that is exactly what has happened for the Alaskan race. The data depicted in figure 2 shows that the measurement of vote spread randomness increased 3 fold for the hand counting process versus the electronic ballot counting process on November 5th.
Of note is that in the Minnesota Senate race the "spread randomness factor" was 1.720 or 8 times more random in the progression of its snap-tallies throughout the night (figure 3).**
A third possibility to explain this significant difference between the hand counting and the electronic ballot counting in the Alaskan Senate race would be much more nefarious. If the Alaskan race goes to a hand-counted recount like that of Minnesota some of these questions and anomalies will most assuredly be answered.
** The discussion on the strange vote subtractions in the Minnesota Senate race has been discussed previously in the following article.


