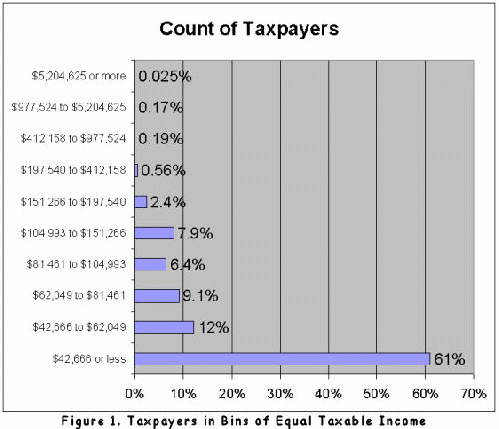
At the end of my earlier article, Who Pays Taxes? was a table which broke down incomes into equal sizes according to taxable income. The limits of the income bands were estimates, based on data available from the IRS for 2006.
This article will elaborate further on these bins of taxpayers. You should keep in mind that the taxpayers in each bin receive 10% of the nations personal taxable income.
Figure 1 shows the number of people in each bin. It is not surprising that as income levels rise the number of taxpayers in a bin fall.Figure 2 shows the percent of income taxes collected from taxpayers in each bin. In considering this chart it may be useful to go back to the earlier article, Who Pays Taxes?, and review Figure 7 and Figure 7a in that article.
Income taxes are not the only taxes collected by the federal government. The other most significant tax collected is the payroll tax. In the year 2006, this tax was charged at 7.65% on taxable income up to the limit of $94,200 and income beyond that limit was not taxed.
Figure 3 shows how the collection of taxes is affected if you take the broader definition to include both income and payroll taxes. This is not at all an unreasonable way to look at the overall tax picture since overall government reporting of the budget generally includes Medicare and Social Security, which is what the payroll taxes are dedicated to in theory (though these payroll taxes are borrowed by the government to fund other needs).


