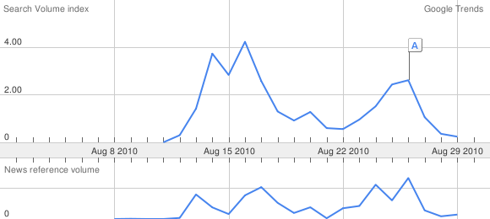
The Hindenburg Omen has been a buzz on Wall Street since it occurred onAugust 12th, 2010 andAugust 20th, 2010. My purpose is not to check its statistical value as a lot of technical analyst have already done that and they almost all agree on the conclusion.
My purpose here is twofold: first to explain what those mean in term of decision making and second to put that in perspective by introducing another data the shape of the yield curve.
Google Trend for Hindenburg Omen
Yes Folks, Hindenburg Omen Tripped Again from the Wall Street Journal.
Hindenburg Omen on Wikipedia
Mixed Signals and the Hindenburg Omen from Forbes
Since its publications most of the bloggers and journalists have explained us that the Hindenburg Omen had no value because it gave false signals 75% of the time.
However:
This is probably true and even its creatorJim Miekkaadmits it:
"But the essential issue here is one of insurance, with a relatively modest premium, against a potentially catastrophic, very low probability event."
(Note: You can view every article as one long page if you sign up as an Advocate Member, or higher).
If all the crash were preceded by the Hindenburg Omen in 75% of its occurrences were false signal.
But still we must act as risk neutral investors so we must study the probability and the return of the two possible outcomes:
1 - How much would you make if you didn't sell and the market was up (probablility 75%) = G.
2 - How much would you lose if you didn't sell and the market crashed (probability 25%) = L


